Recovery Kinetics of Serum Albumin in Pediatric Cancer Patients: Its Determinants and Correlation with Outcomes
Abstract
Introduction: Hypoalbuminemia and cancer-cachexia are established predictors of poor survival and increased chemotherapy toxicity in adult cancers. However, limited literature explores these associations in pediatric oncology. Additionally, the recovery kinetics of serum-albumin during therapy and its impact on clinical-outcomes remain poorly understood. This study investigates the determinants and impact of serum albumin levels at various time-points in pediatric cancer patients. Objectives are to analyze trends and determinants of serum-albumin at baseline and during therapy (3, 6, and 12-months), to assess the impact of serum albumin levels on 3-year overall survival (OS) and event-free survival (EFS) and to explore the relationship between hypoalbuminemia and systemic symptoms, nutritional status, inflammatory markers, and treatment-related toxicities.
Methodology: This retrospective study included 402 pediatric cancer patients (≤18years) treated at a single tertiary-center. Baseline systemic symptoms, stage/risk group, nutritional status, serum-albumin at baseline,3-months,6-months and 12-months of therapy were recorded along with outcomes like relapse/death and toxicity. Multivariate-regression, and survival-analysis was conducted using Cox proportional-hazards models to identify the determinants and impact of serial albumin values [Figure-1].
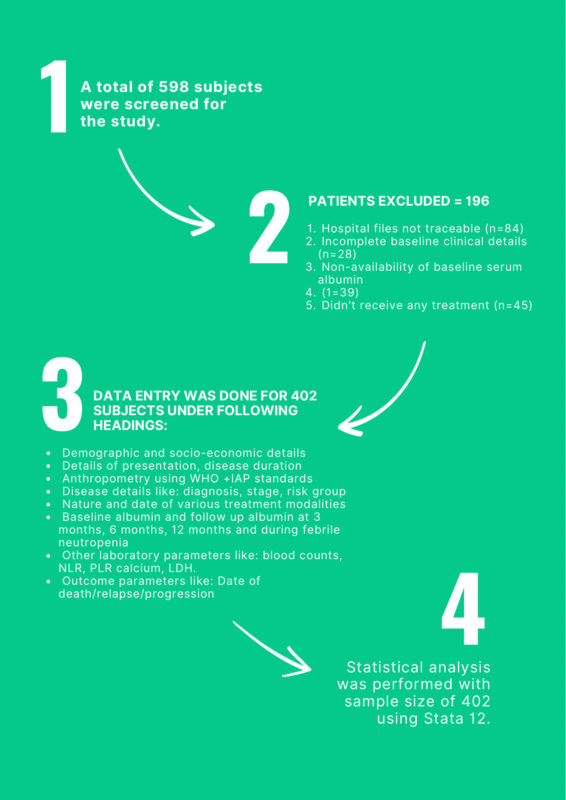
Figure 1: Flow chart depicting our study outline.
Results : A total 402 patients were enrolled, with median age of 4yrs (2.5mo-14yrs), majority being hemato-lymphoid cancers (57.71%). The predictive cut-off albumin was 4.0g/dl [Figure2]. Prevalence of hypoalbuminemia at baseline, 3m and 6m were 46.52%,26.45% and 22.0% respectively. The 3-year overall-survival (OS) was lower for patients with hypoalbuminemia at baseline (44.9% vs 69.8%;HR=2.1,P=0.00), 3m (HR=2.28;P=0.00) or 6m (HR=2.02;P=0.001) in univariate-analysis [Figure-3]. On multivariate-analysis, only risk-group (HR=1.74;P=0.01), 6m albumin (HR=3.33;P=0.00) and first 6m albumin-trend (HR=1.84;P=0.02) were independent predictors of OS.
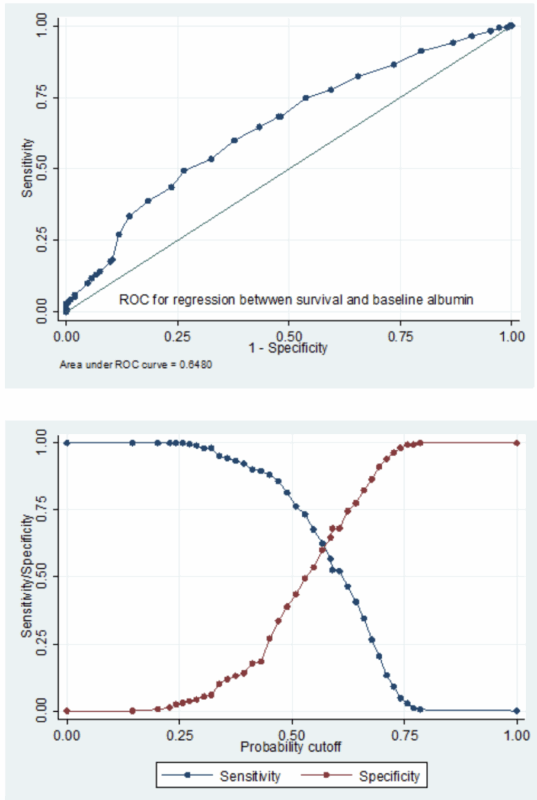
Figure 2: Cut off point estimation using logistic regression between survival or death as a binary dependent variable and baseline albumin as a continuous independent variable (A) ROC of the logistic regression (B) Calculating the maximum Youden’s index from sensitivity/specificity vs probability plot
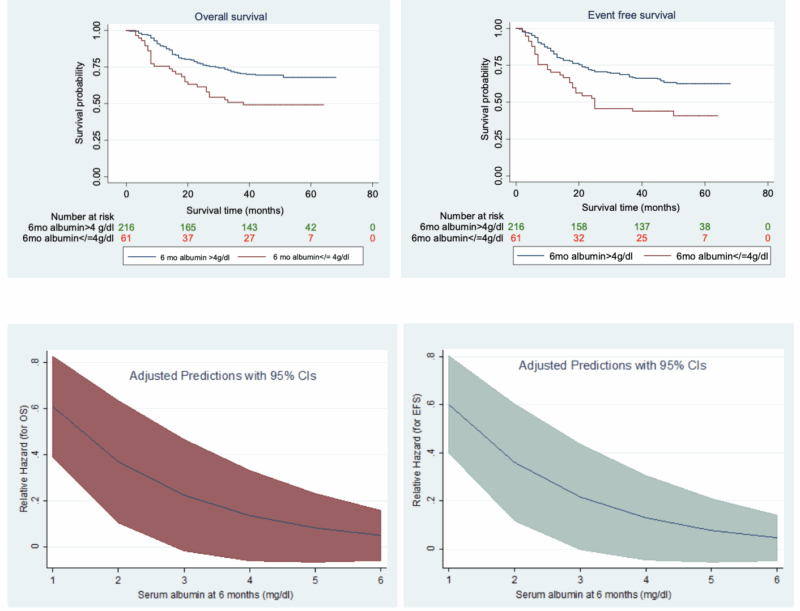
Figure 3: Kaplan-Meier curve depicting the impact of 6-month albumin value on (A) OS and (B) EFS along with margins plot depicting relative hazard as a function of serum albumin at 6 months in relation to (C) OS (D) EFS, in the univariate analysis
Liver/spleen size (r=-0.39) and serum-globulin (r=-0.37) had moderate negative correlation with baseline-albumin.
On multivariate-analysis, systemic-symptoms (OR=8.01,P=0.01) and baseline-malnutrition (OR=2.08;P=0.00) predicted baseline-hypoalbuminemia, while 6-months albumin was dependent only on baseline-systemic-symptoms (OR=5.28;P=0.01) [Figure-4]. Also, hypoalbuminemia at baseline, 3m or 6m was associated with increased risk of febrile neutropenia (OR=1.29;P=0.01) and hospitalization (OR=2.86;P=0.00).
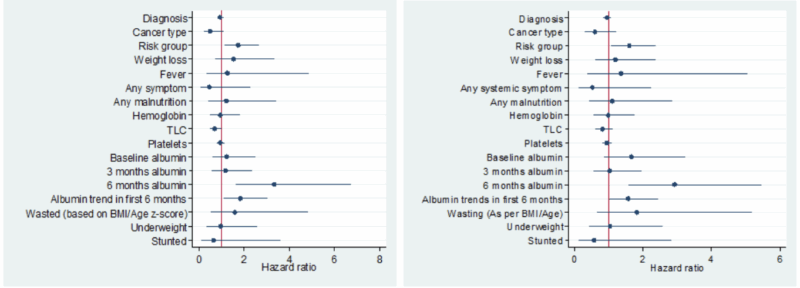
Figure 4: Coefficient plot depicting hazard ratios in the multivariate analysis of factors found significant in univariate analysis for predicting (A) OS (B) EFS
This study emphasizes that serum albumin at 6 months, rather than baseline, is a superior predictor of survival, likely reflecting cancer-related inflammation and cachexia. The findings suggest that albumin recovery-kinetics could serve as a dynamic biomarker for disease progression and response to therapy.
Conclusion: While baseline-albumin is influenced by malnutrition, systemic-symptoms, inflammatory state (hypergammaglobulinemia) and disease-bulk (organomegaly), the 6-months-albumin is independent of baseline-malnutrition and likely a better indicator of the cancer-inflammation-cachexia-cascade to predict disease-outcomes in pediatric-cancers [Figure-5].
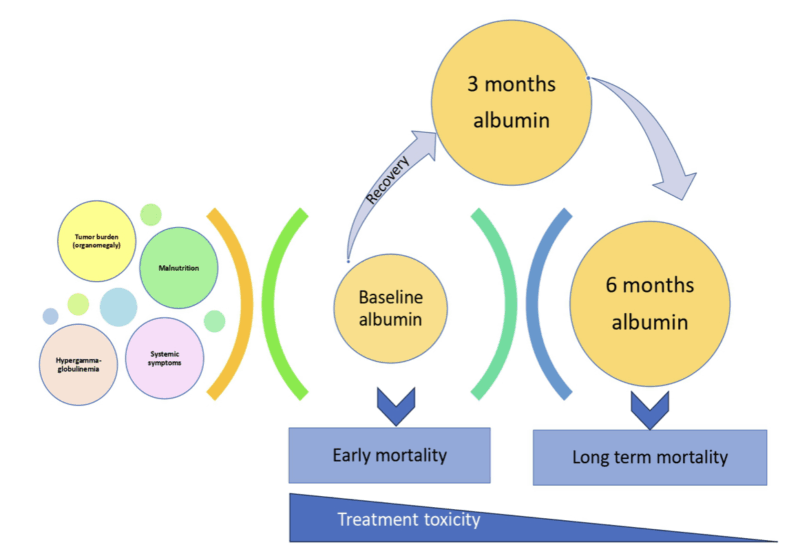
Figure 5: Schematic presentation of serum trends affecting the survival in pediatric cancers


